Trevor Maxwell

Translating Data To Insightful Stories
View My LinkedIn Profile
The advancement of AI piqued my interest. What started as an exploration of the emerging technology
turned into a career transition. I am excited to be working as a technical business analyst. I am
looking forward to what I will continue to learn and discover.
PRESS HERE to read full article
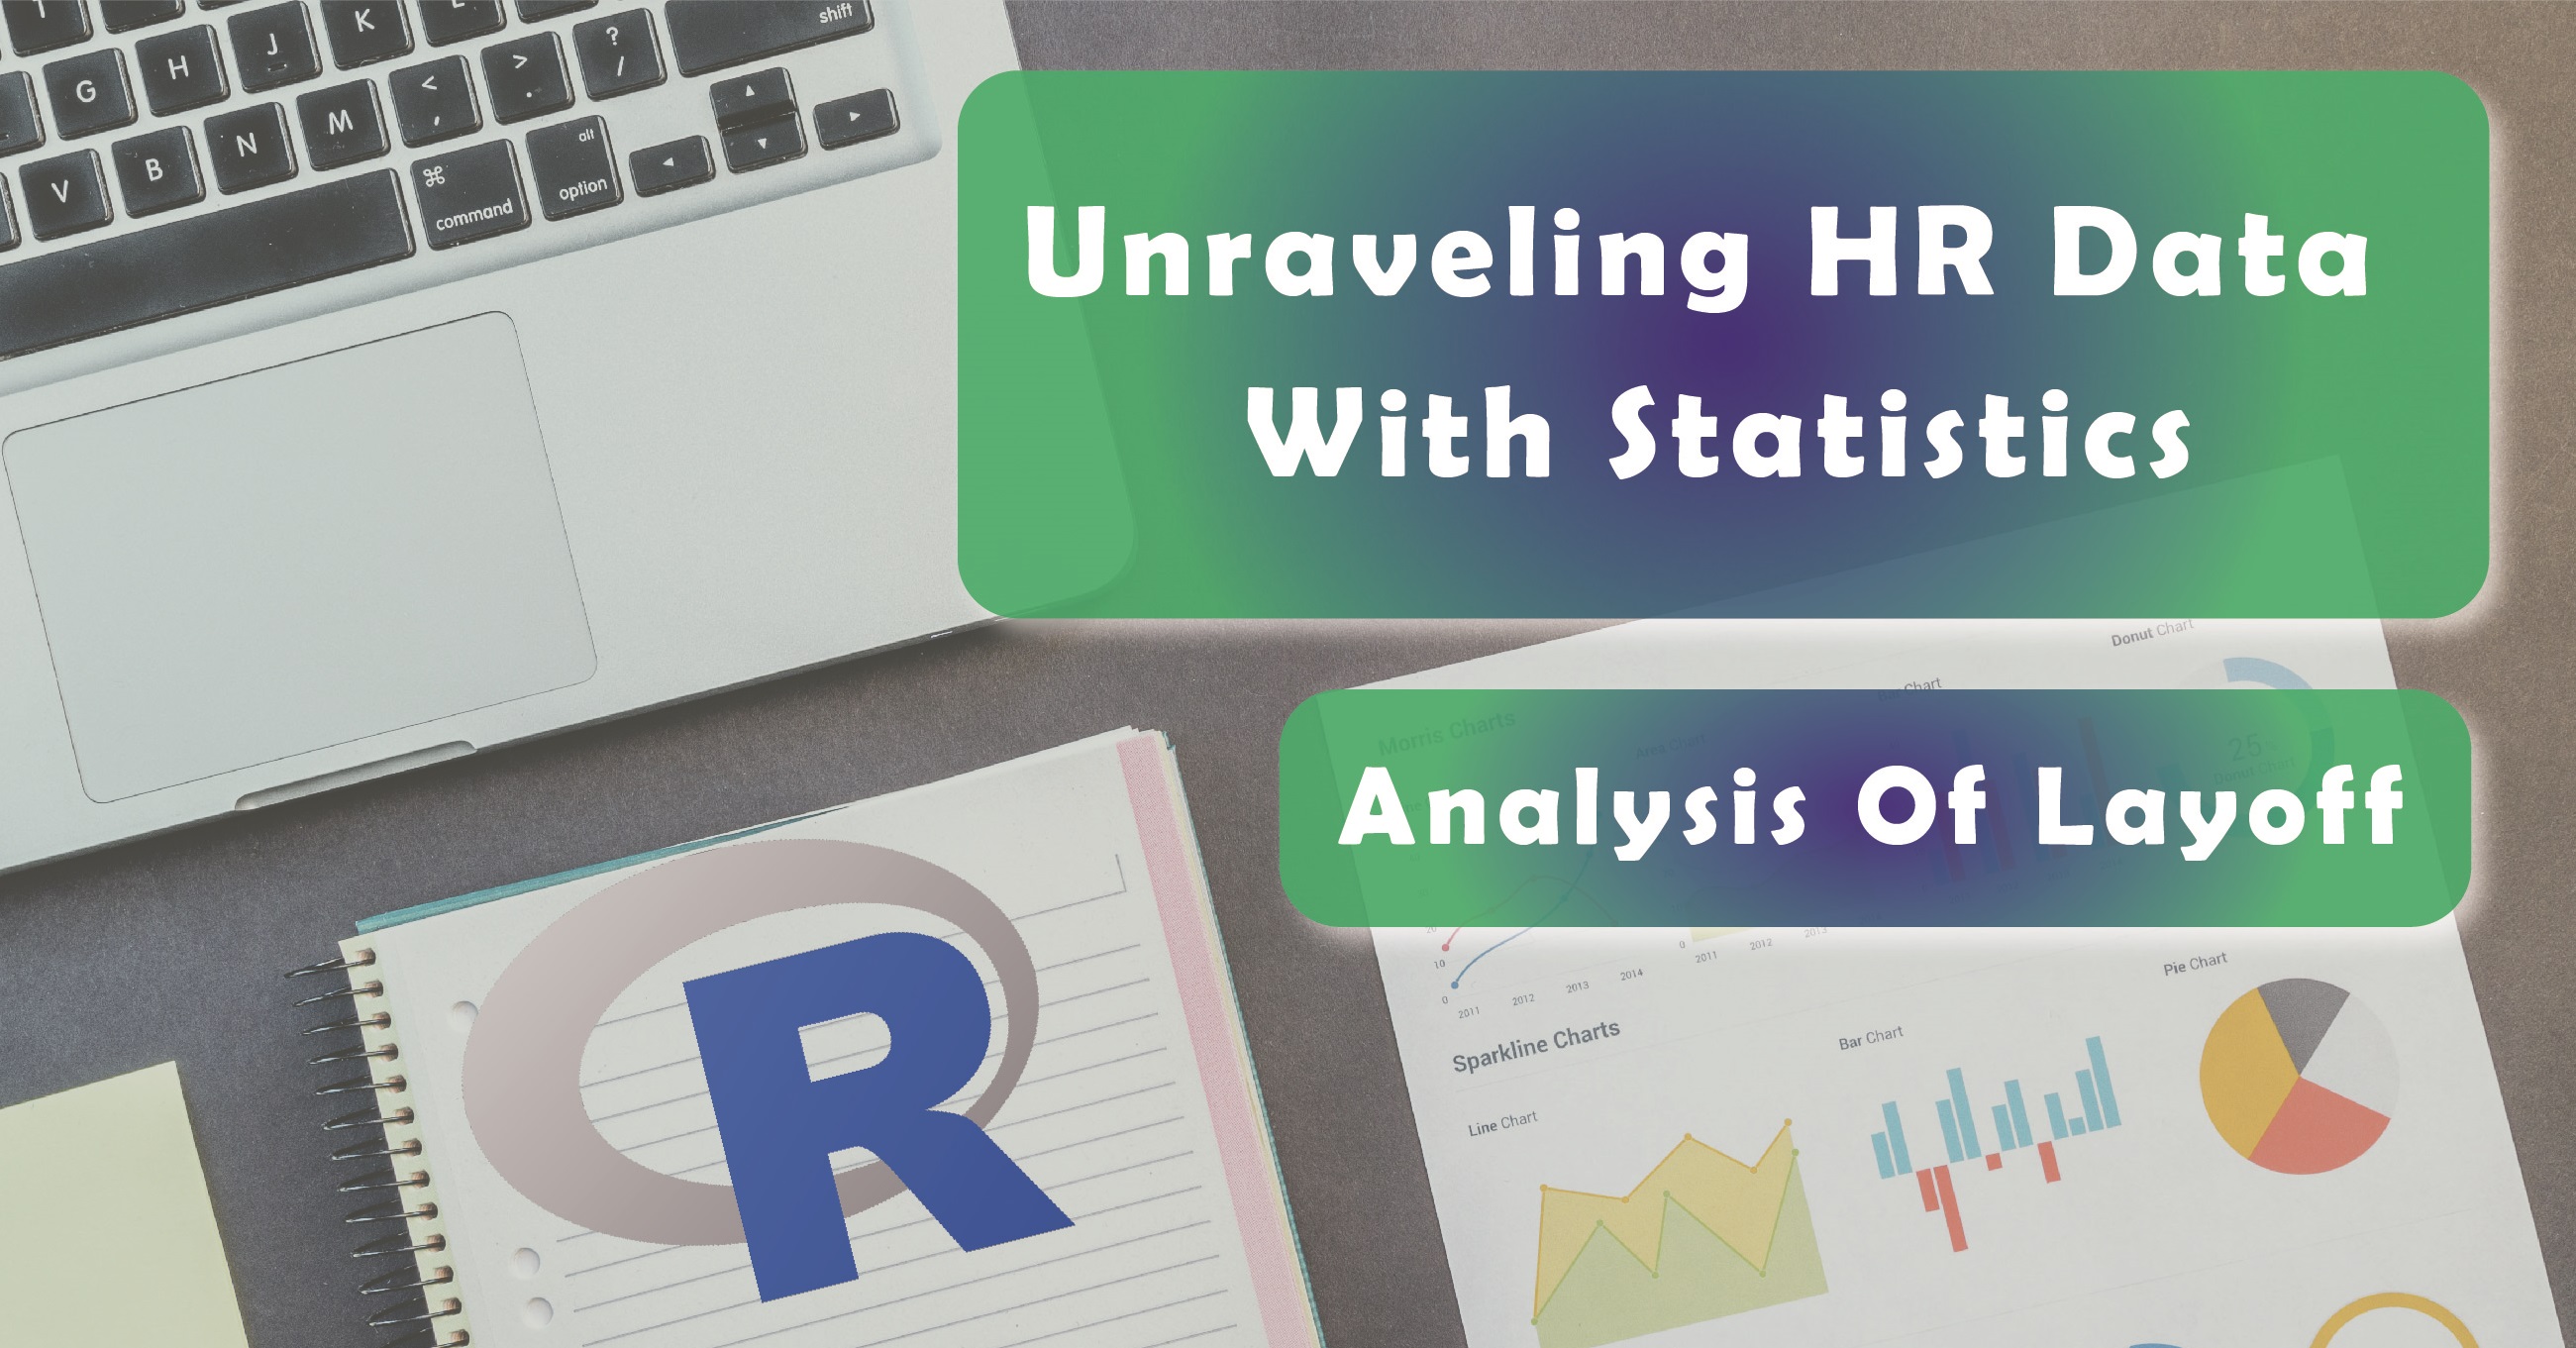
In my HR data research, I used advanced statistical tools such as R and Logistic regression to investigate age, gender, commute, and if they impact employee attrition over time. I identified high-attrition job roles and the importance of commute distance using my experience in data visualization.
PRESS HERE to read full article
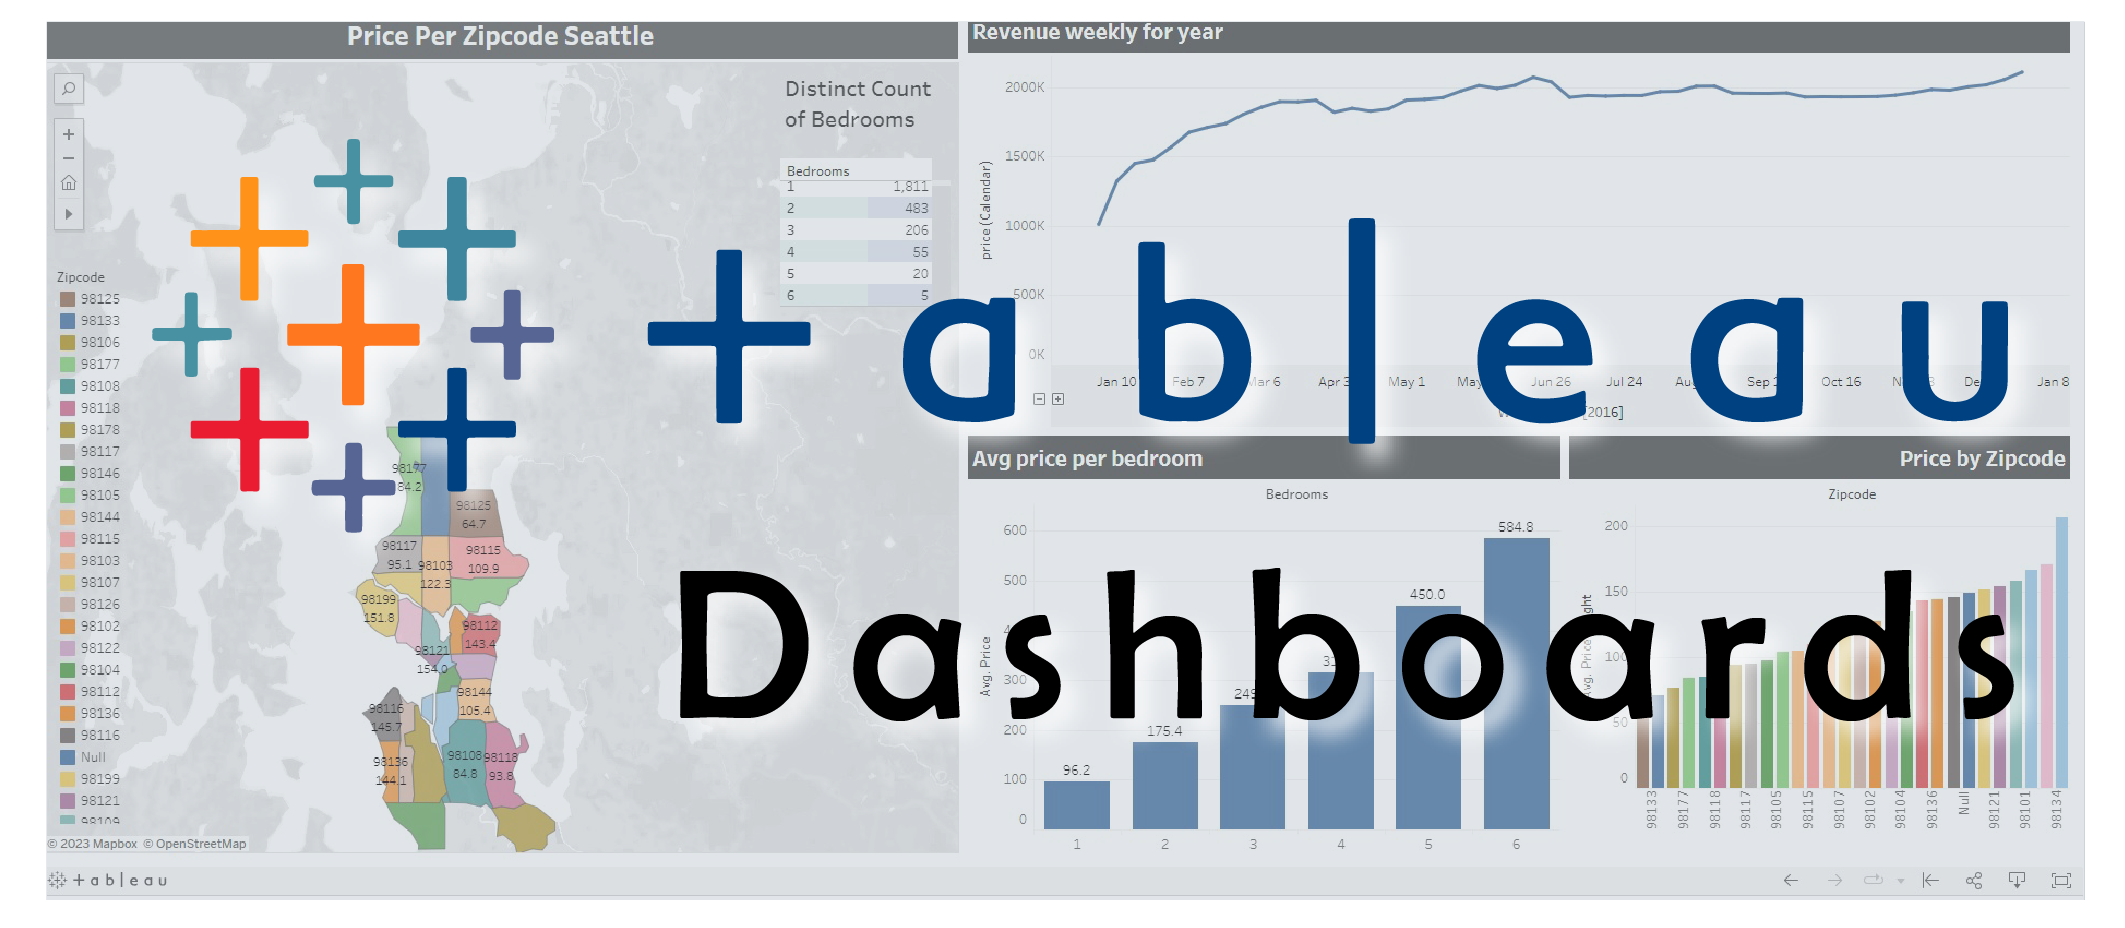
Diving into the World of Twitch: A Data-Driven Exploration of Gaming Insights. I found surprising discoveries in top-performing games and Twitch’s remarkable growth over 7 years. My goal was to empower marketing decisions with informed data. This project took elements of Tableau, SQL, and Excel to showcase my skills.
PRESS HERE to read full article
Discover the potential of data analysis in iron ore flotation! Python abilities used for correlation, time series, and regression analysis were done with Pandas, Seaborn, and Matplotlib. Inside the article, you will learn about Amina Flow, Ore Pulp Density, and percent Iron Concentrate. Investigate August’s low points and steady pH levels.
PRESS HERE to read full article
Dive into an amazing data tale highlighting significant insights from the NBA season in 2022. Discover the value of teamwork with Tableau, with high connections between assists and points. Discover elite players between the ages of 25 and 30 who are dominating the game. Observe how point guards flourish. Explore the interactive data story on Tableau public.
PRESS HERE to read full article

Unveil insights from 101,766 patients across 130 hospitals. The data was cleaned and analyzed with MYSQL. Learn from six success stories, reduce average hospital stays, and prioritize efficient cardiology care. Equitable treatment across races was observed. Recommendations focus on freeing up beds, improving procedures, and maximizing healthcare resources.
PRESS HERE to read full article
Investigating IDA Loans. Using MySQL to Discover useful information from the World Bank’s IDA statement of credits and grants for November 2022. Discover the countries with the biggest debt and loans, as well as the most recent payer. Key insights emphasize debt management and opportunities for additional research.
PRESS HERE to read full article

Using only Excel put together analysis and visualizations for this project. Discover customer demographics: married, aged 36-50, top spenders. Leverage gift cards for slow months. Attract parents with family-friendly options. Appeal to price-conscious customers with flash sales. Ideas to boost loyalty, and revolutionize food delivery together!
PRESS HERE to read full article

This study was done using Tableau. The article presents the key insights that I found. Decisions regarding high school education affect almost a million students. Analysis reveals 162,137 students didn’t graduate, while 585,791 pursued higher education. Recommendations on enhancing assistance programs, and college collaboration for educational optimization.
PRESS HERE to see my Tableau public