Trevor Maxwell

Translating Data To Insightful Stories
View My LinkedIn Profile
The advancement of AI piqued my interest. What started as an exploration of the emerging technology
turned into a career transition. I am excited to be working as a technical business analyst. I am
looking forward to what I will continue to learn and discover.
Surprising Insights Into Food Delivery!
The Setup
The food delivery industry is rapidly growing and you’ve likely heard of it even if you haven’t used it yet. The following data is made for the marketing team at DoorDash. I thInk its relatable to everyone and I hope you find it interesting to read!
If you’re curious about where you fit in the data, keep reading! We’ve gathered some fascinating insights. We analyzed:
- Age groups
- Marital status
- Presence of children
- Popular months
- High vs low income
- Food categories.
The Project
DoorDash had requested an evaluation of the 6th campaign’s success. They have also asked for ideas to improve sales on the platform.
By using pivot tables, charts and some linear regression, sales can be analyzed and broken down into demographic groups. We have put together some visuals to make the information easy to follow.
- The results give a clear picture of who their loyal customers are.
- Slower times of year show an opportunity for gift cards.
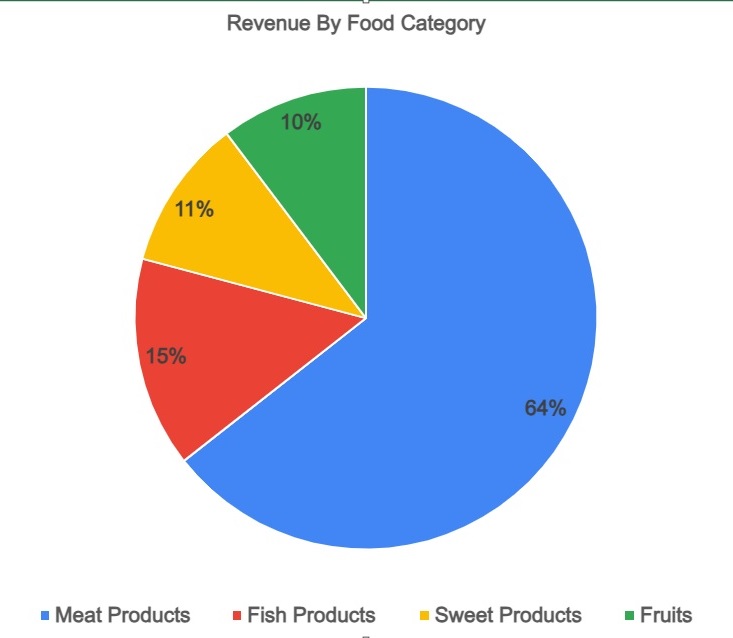
- Meat is the most important category for generating revenue.
- There is a correlation of 0.75 with higher income to the amount spent.
The Data
These visuals are only looking at customers who purchased during Campaign 6
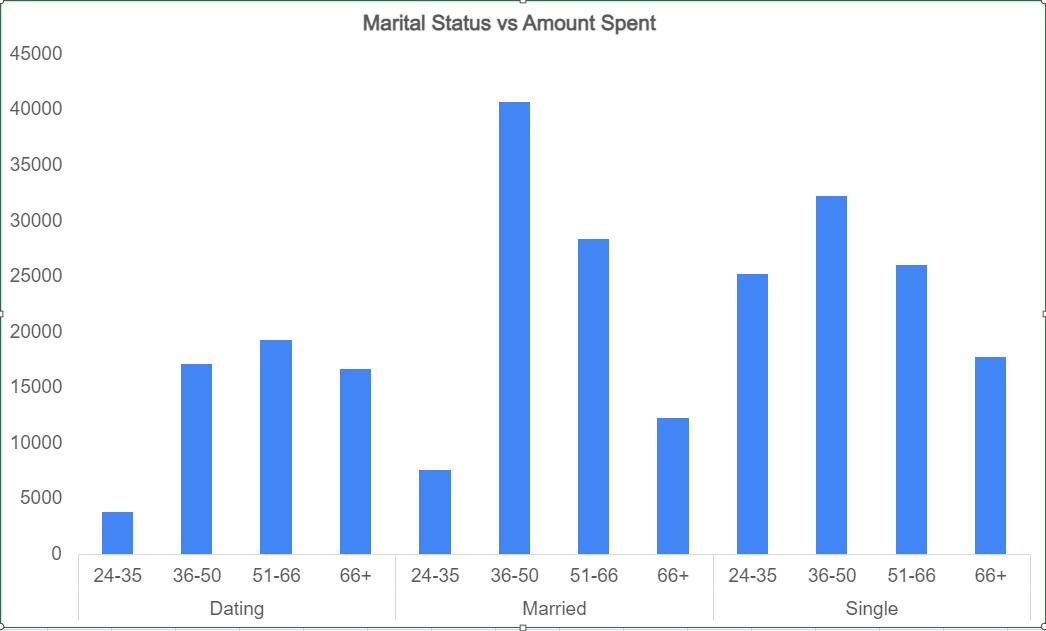
Based on this chart, both single and married individuals tend to spend
more money than couples who are dating. Additionally, married couples between
the ages of 36 and 50 seem to spend the most.
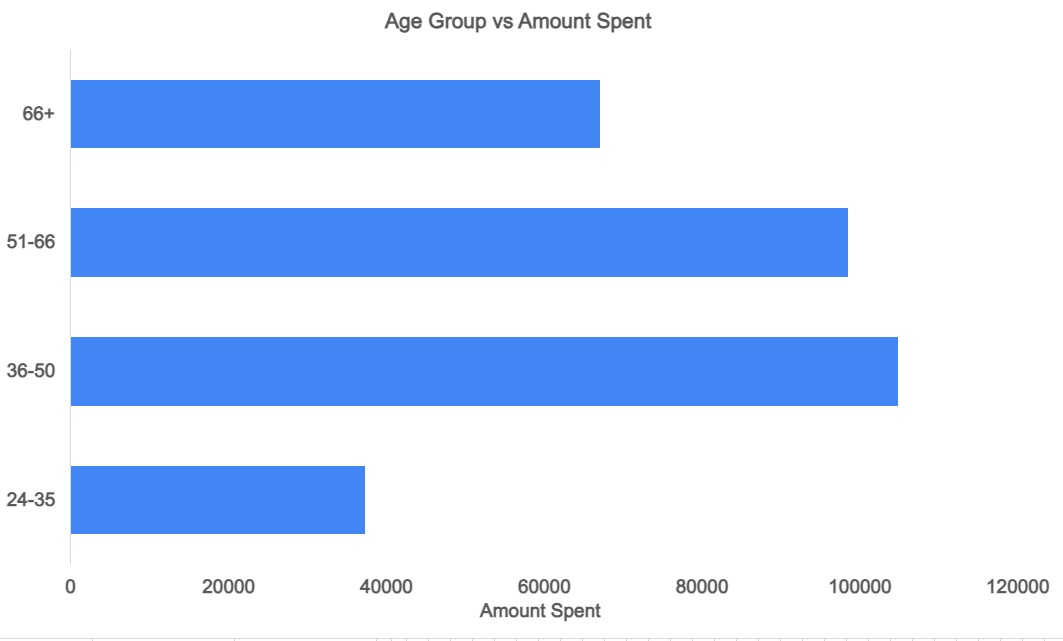 According to this chart, the age group of 36 to 50 spends the most,
with the age group of 51 to 66 coming in a close second.
According to this chart, the age group of 36 to 50 spends the most,
with the age group of 51 to 66 coming in a close second.
Now Let’s examine the role of children in consumer spending.
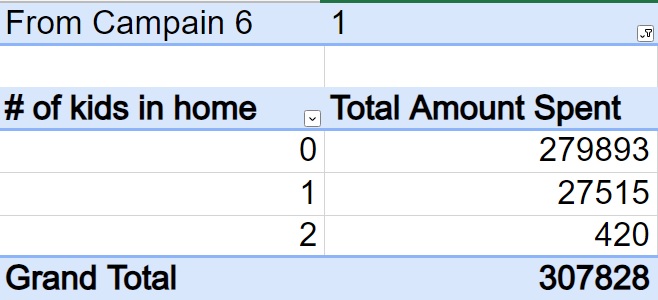
According to this table, individuals without children spend 10X more on food delivery than those with children.
This chart displays the months in which customers joined DoorDash.
January and March were the most popular months for customer sign-ups,
while November and December had the lowest number of new customers.
Here we have a revenue by food category pie chart that displays the percentage
of the most popular selling products. Meat is a clear winner.
Lastly here is a scatterplot that displays the relationship between income and total money spent.
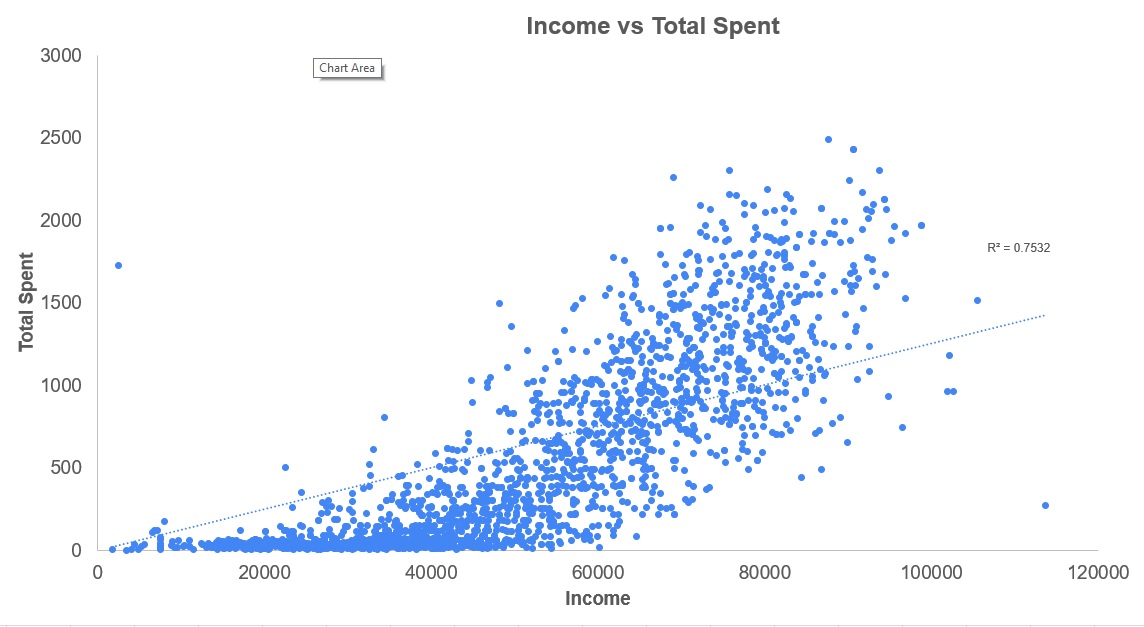 It indicates a strong correlation of 0.75, which means that as people’s income increases, they tend to spend more money.
Takeaways
The insights gathered from Campaign 6 regarding marital status and age groups can help us concentrate on our ad campaigns and target the people who enjoy our service most. By building a brand that resonates with our top customers, we can enhance their loyalty, resulting in increased spending with us.
One idea that comes to mind is offering gift card incentives to encourage people to use us for their Christmas gifts to make purchases, thereby boosting sales and attracting new customers in December.
Also, It may be worthwhile to conduct further research to understand why parents with children are not using food delivery services as often. While it could be due to having less disposable income, gathering more data could help us offer products and services that are attractive to this demographic.
As meat products are generating the highest revenue, it would be useful to share this information with our restaurant partners. They can use it to increase their sales by focusing on this category and offering more meat products. This can also encourage users to utilize our platform more frequently.
Based on the correlation between high income and sales, it appears that a significant portion of our customer base is paying close attention to price. This presents an opportunity to enhance our platform by adding features that allow our customers to access great deals and enjoy our services even more.
Exp: For instance, we could ask if they would like to receive notifications about flash sales by opting into a special email list. Our restaurant partners could benefit from this by using flash sales to quickly clear out nearly expired food.
If you find this article interesting, please connect with me on LinkedIn. I will be posting more like it.
Avery Smith assigned me this data project, which includes a data set provided by DoorDash for educational purposes.
*Note this project is modified from an iFood job interview case study given by the Brazilian equivalent of DoorDash, iFood. The data is 98% real but slightly modified for educational purposes.
*Original Data Set: *Click Here.
 .
.