Trevor Maxwell

Translating Data To Insightful Stories
View My LinkedIn Profile
The advancement of AI piqued my interest. What started as an exploration of the emerging technology
turned into a career transition. I am excited to be working as a technical business analyst. I am
looking forward to what I will continue to learn and discover.

HR Is challenging walking the fine line of equality today.
Introduction
Using the HR data from IBM, we’re going to look at some employees that were laid off, left, or fired from the company. Original data is found here. Statistics are amazing because they take the emotion out to show the facts. We are going to ask some hard questions in this article. Then I’m going to show you how I answered the questions using statistics and logistic regression inside R programming language.
Key Questions
- Are older employees being laid off more than younger ones?
- Are the newer employees getting the boot more than the tenure employees?
- Does gender play a role in the turnover?
- Does working overtime help or hurt your chances of staying?
- Which job title is leaving the most?
- What factor does the commute play in employee retention?
Data Analysis
We conducted an exploratory analysis to look into potential age-related prejudice in the company’s workforce, particularly with the retention of older workers. We used a box plot to visualize the distribution of ages among different groups. We also ran a T-test on the data to dig a little deeper into the data. The goal of this analysis is to determine whether age plays a role in employee turnover and whether there is any evidence of a bias toward younger people.
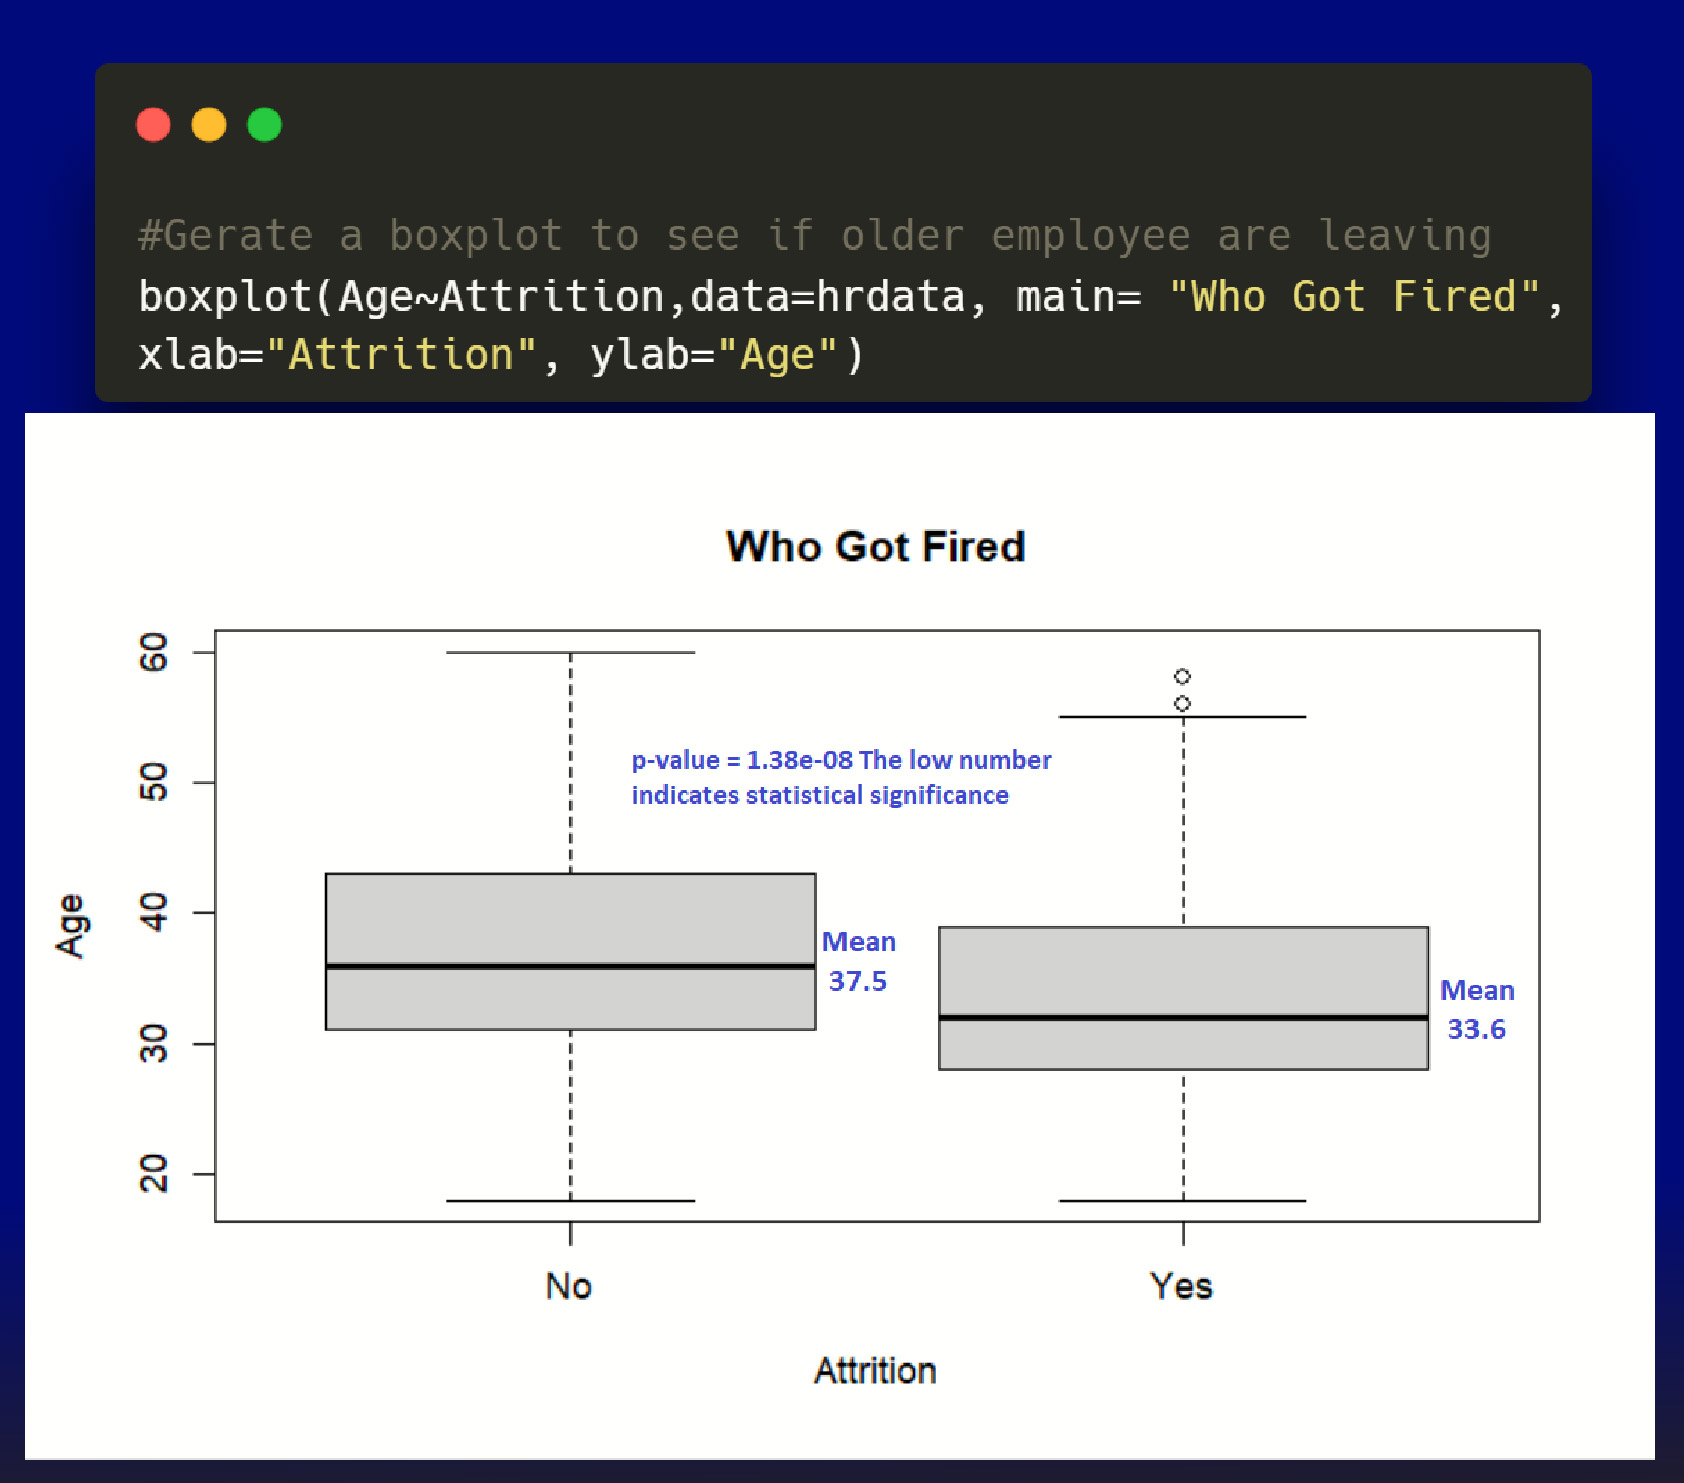
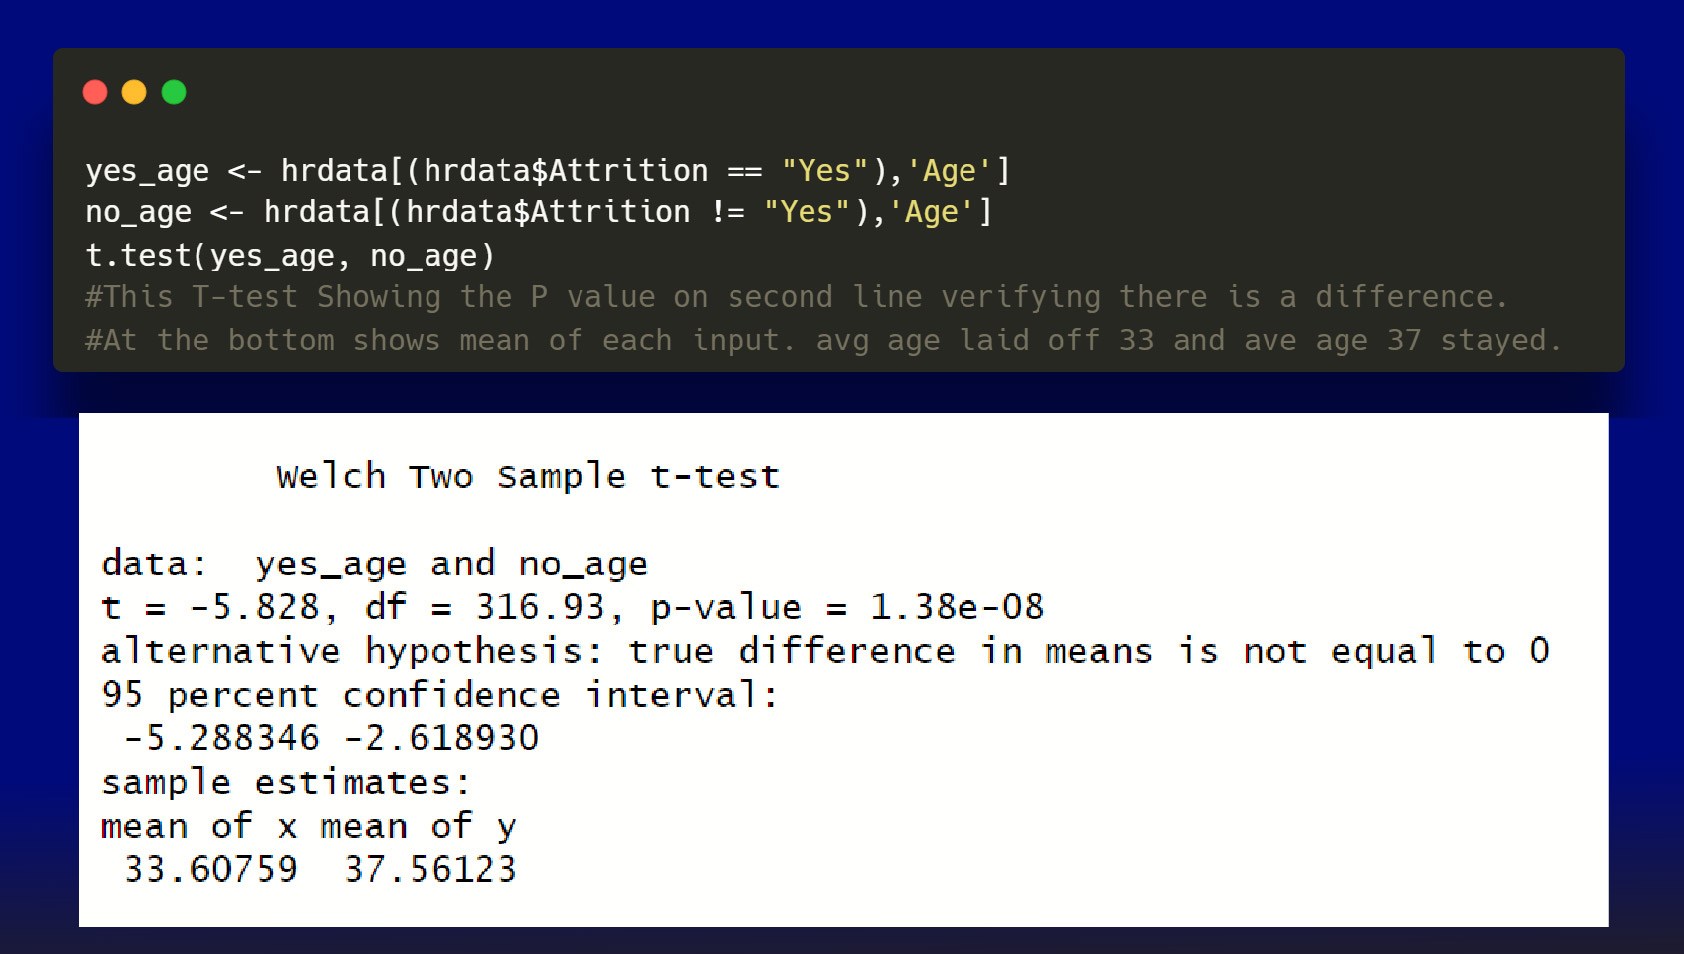 The T-test results has a low P-value, refuting the initial premise that the organization prefers younger staff for retention because the box plot analysis found that an average age of around 38 stayed. Employees who left had an average age of around 34, indicating a preference for retaining older people. It’s also comforting to know that the age gap isn’t very wide, implying that there isn’t much discrimination here.
Using the “EmployeeNumber” column, we investigated the association between employee retention and tenure at the organization. A small employee number denoted employees with a longer tenure, whereas high numbers reflected fresh hires. A box plot was used to clearly show this relationship.
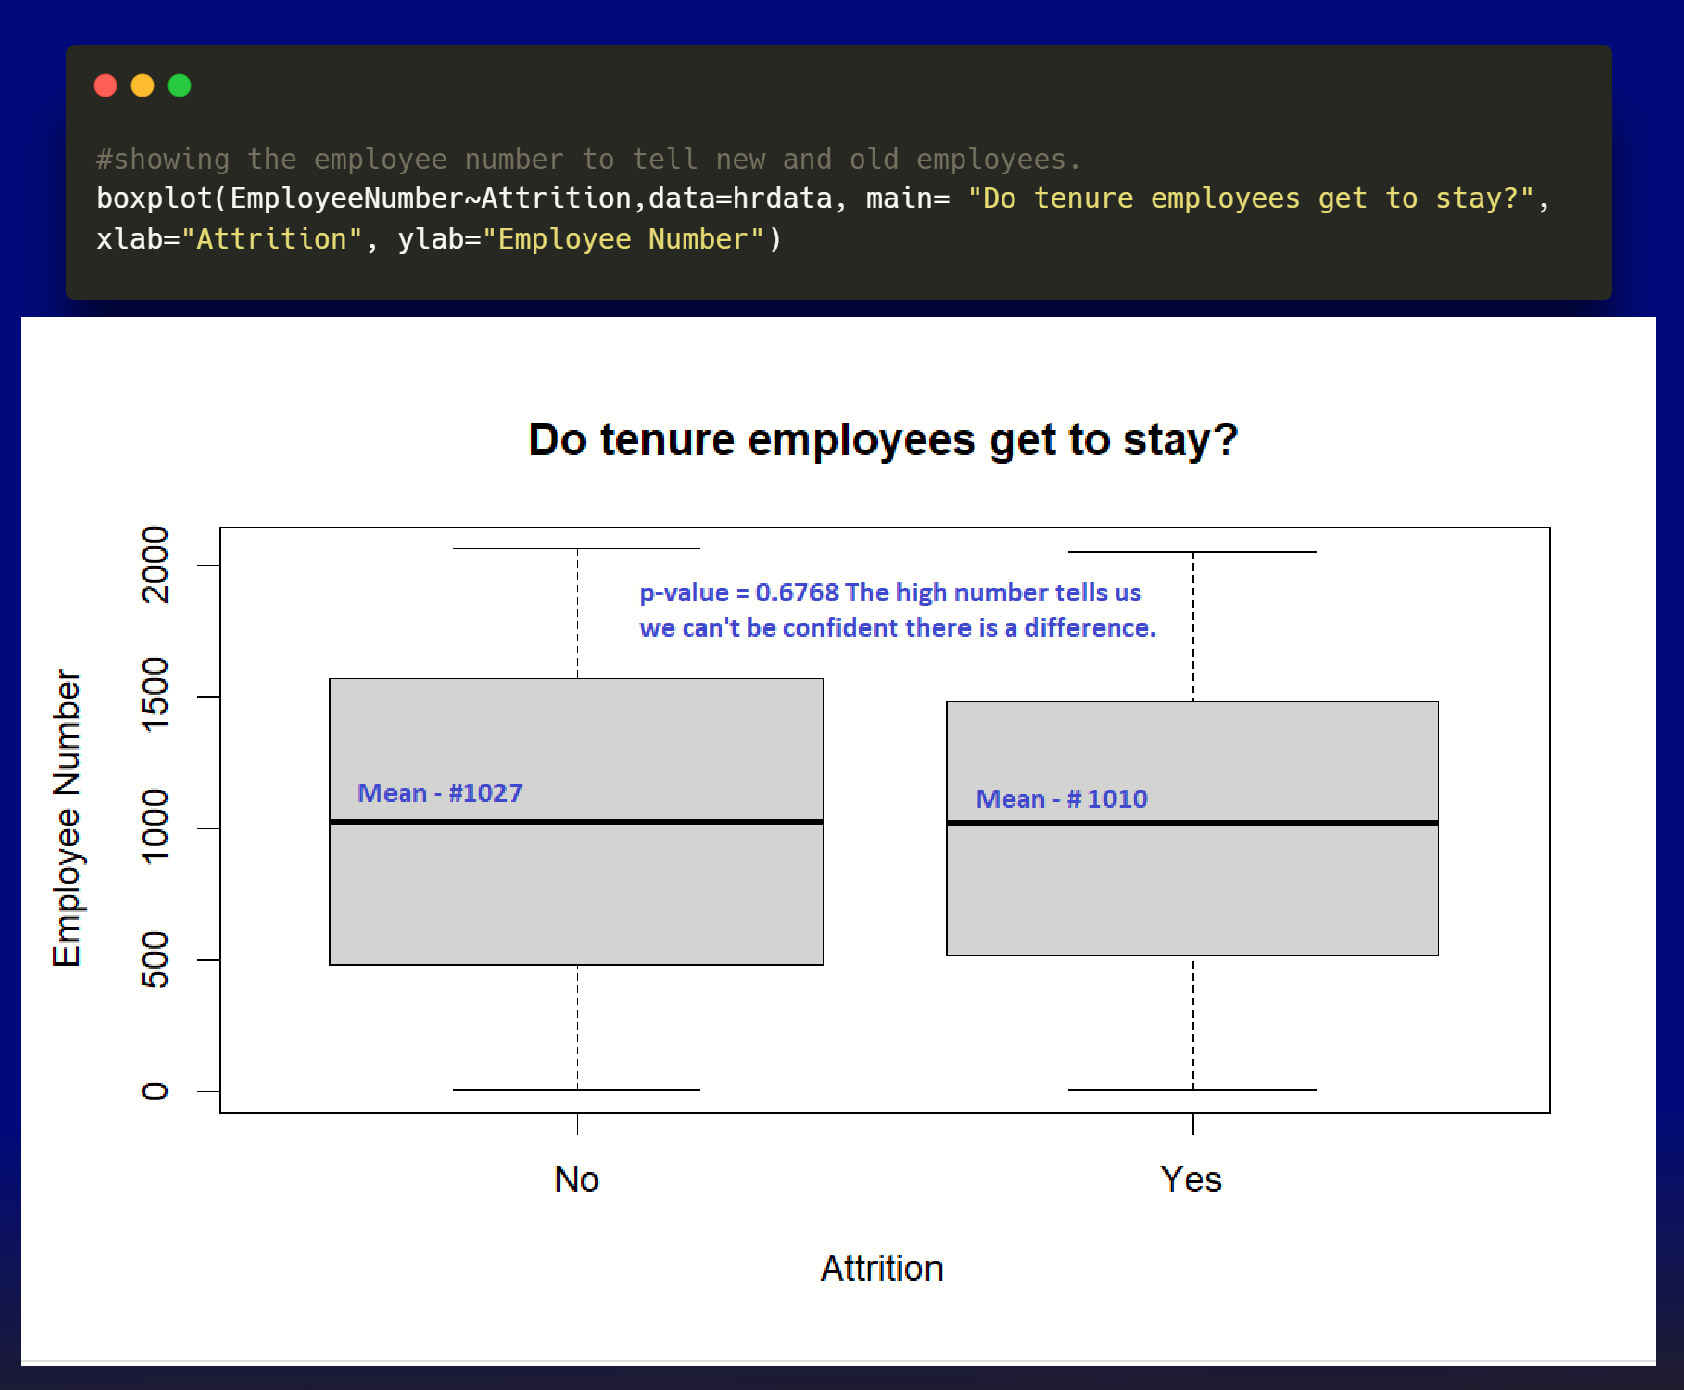 The P-value for the T-test was high, indicating that the variable had basically zero bearing on who was laid off. The investigation indicated only minor variations between new and experienced employees. I would say it appears that this variable has no effect on staff attrition.
We will use logistic regression to investigate the association between gender, overtime work, and employee attrition. The purpose of this study is to see if one gender is targeted and whether working overtime has a good or bad impact. We hope to obtain insight into potential gender inequalities in turnover as well as the impact of extra labor on employee retention.
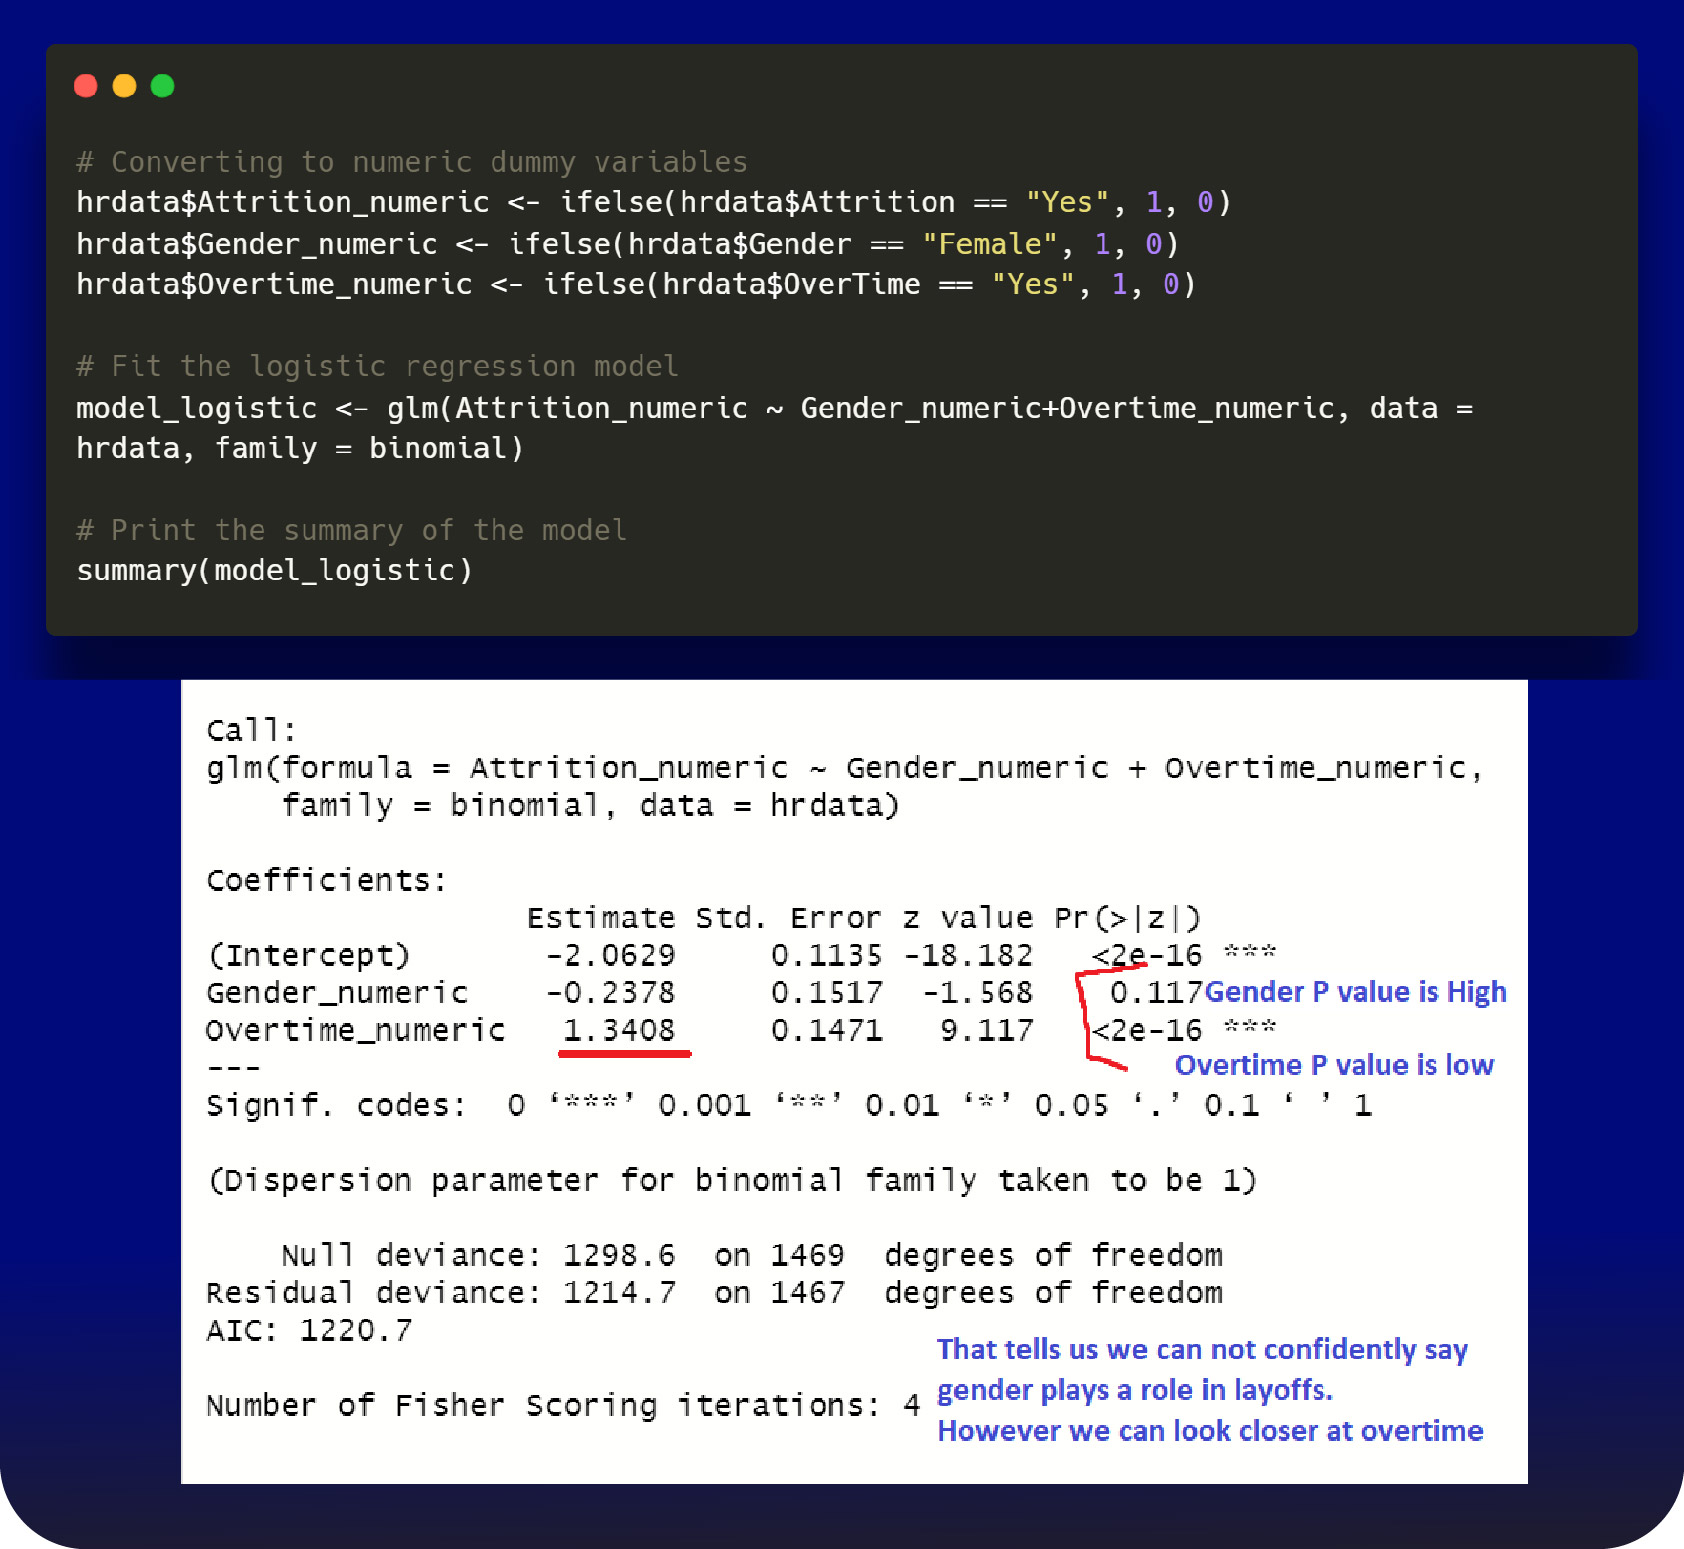
The initial results give us a high P-value for gender, we cannot reliably say that gender plays a role. However, over time shows significance. In order to look at this closer, we convert the coefficient to odds to better understand its impact.
 After converting the coefficient to odds, a notable finding emerges: employees who work overtime are four times more likely to leave or be let go from the company. This indicates a significant impact of overtime work on employee attrition rates.
We proceeded to explore the visually captivating aspect of our analysis—the vertical bar graph! Its goal was to identify the job role with the highest turnover rate. We hoped to obtain valuable insights into potential areas of concern by using this graph to find any areas of the company suffering significant attrition concerns.
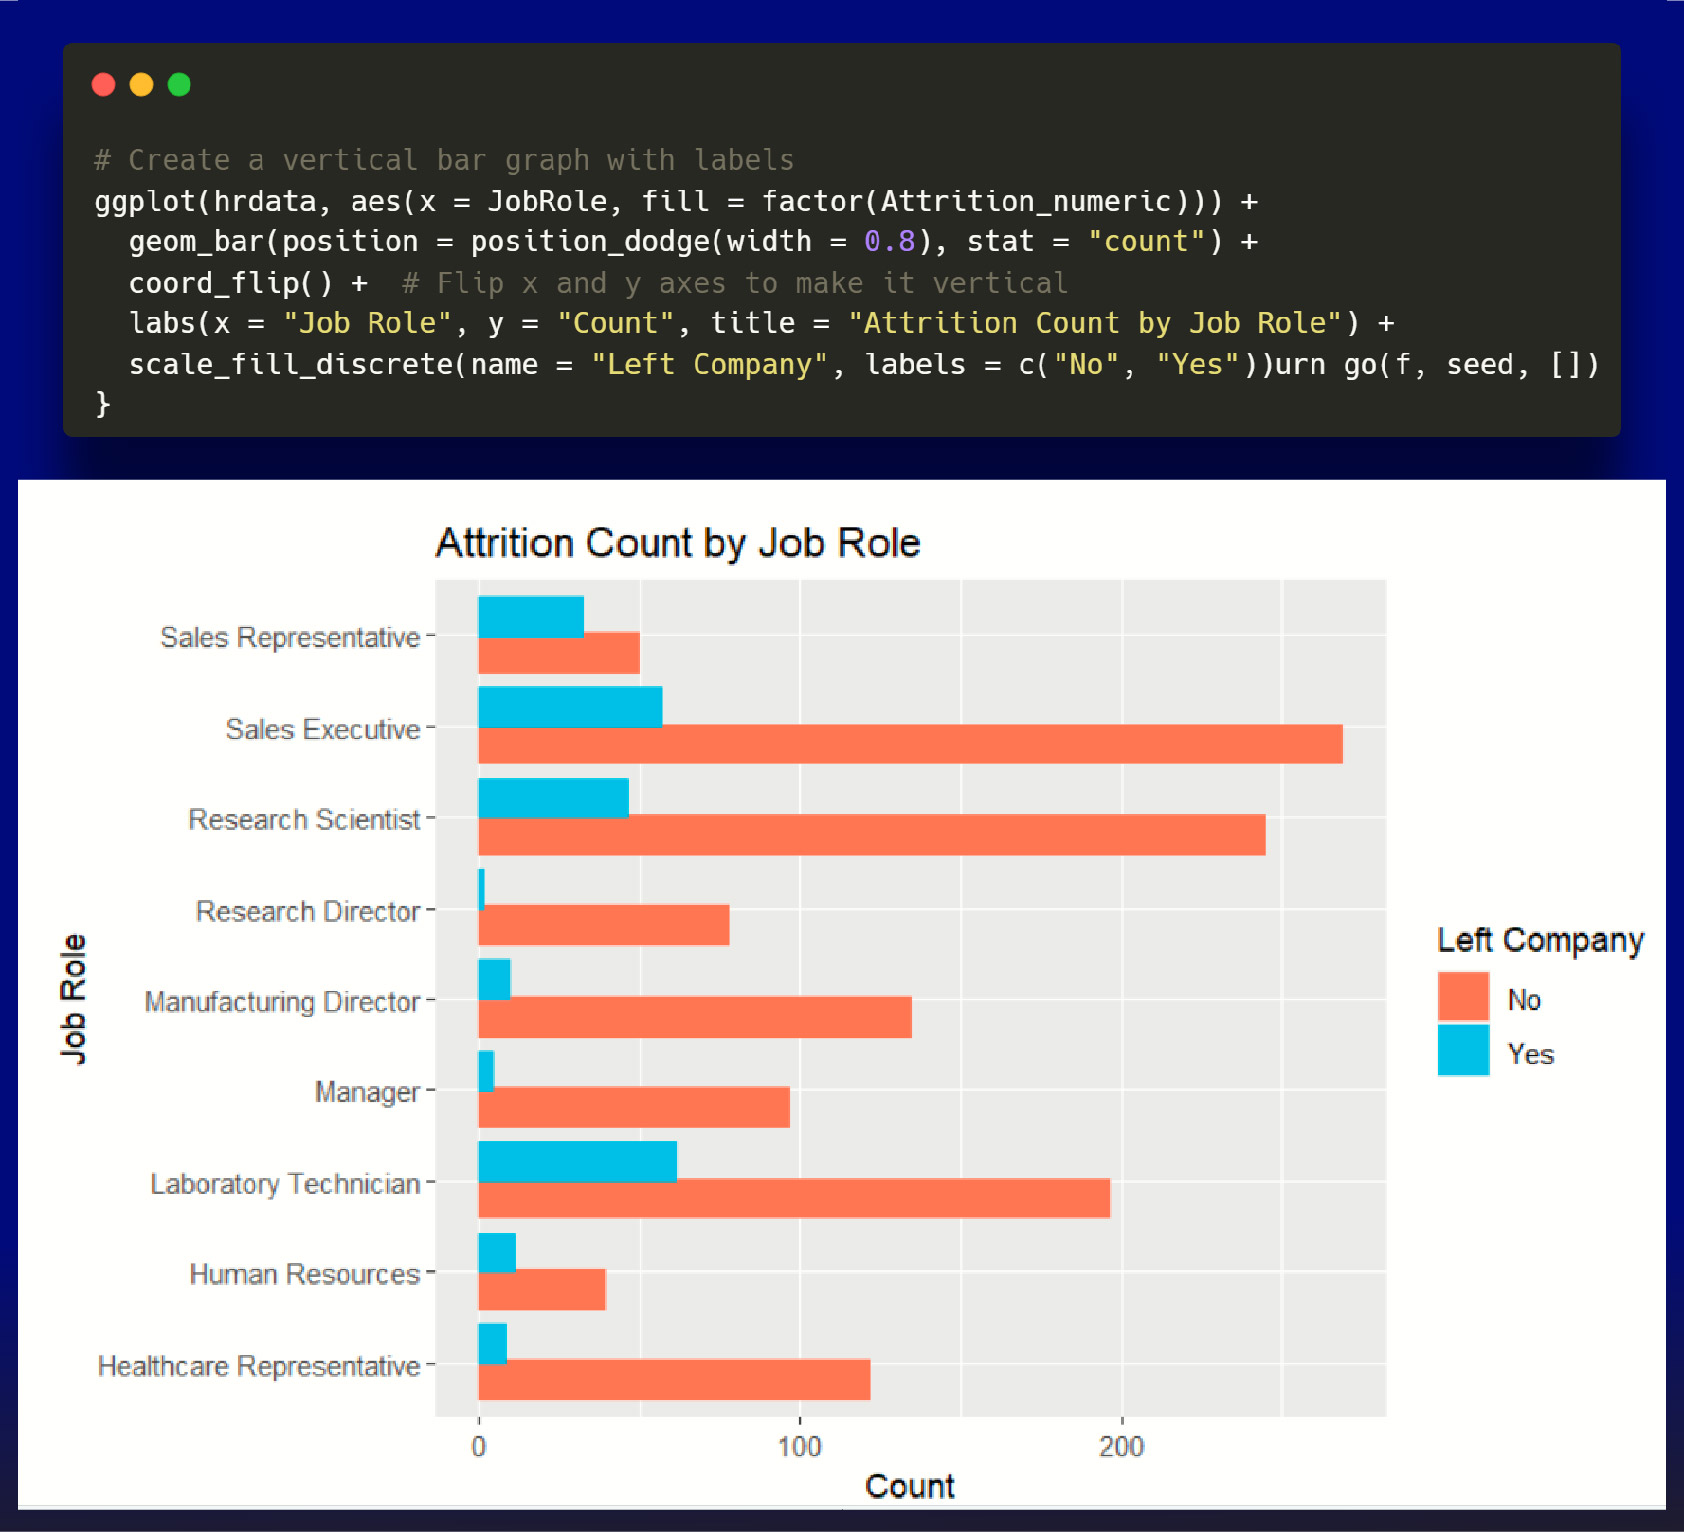 The graph reveals that laboratory technicians had the highest attrition rate, but the sales representative role raises concern, as over half of the employees in that position left the company. More research is needed to understand whether this tendency is normal and whether it is related to management practices within that department. Understanding the reasons behind this departure pattern could aid in addressing potential issues and improving employee retention in the sales department.
The last variable we’re going to look at is everyone’s favorite thing, the commute. How often do you consider this when looking at new job opportunities? I finished off the analysis using a box plot and T-test, we sought to understand if long commute times significantly impacted employee attrition. By delving into this, we aimed to gain insights into whether commuting longer plays a significant role in employees leaving the company.
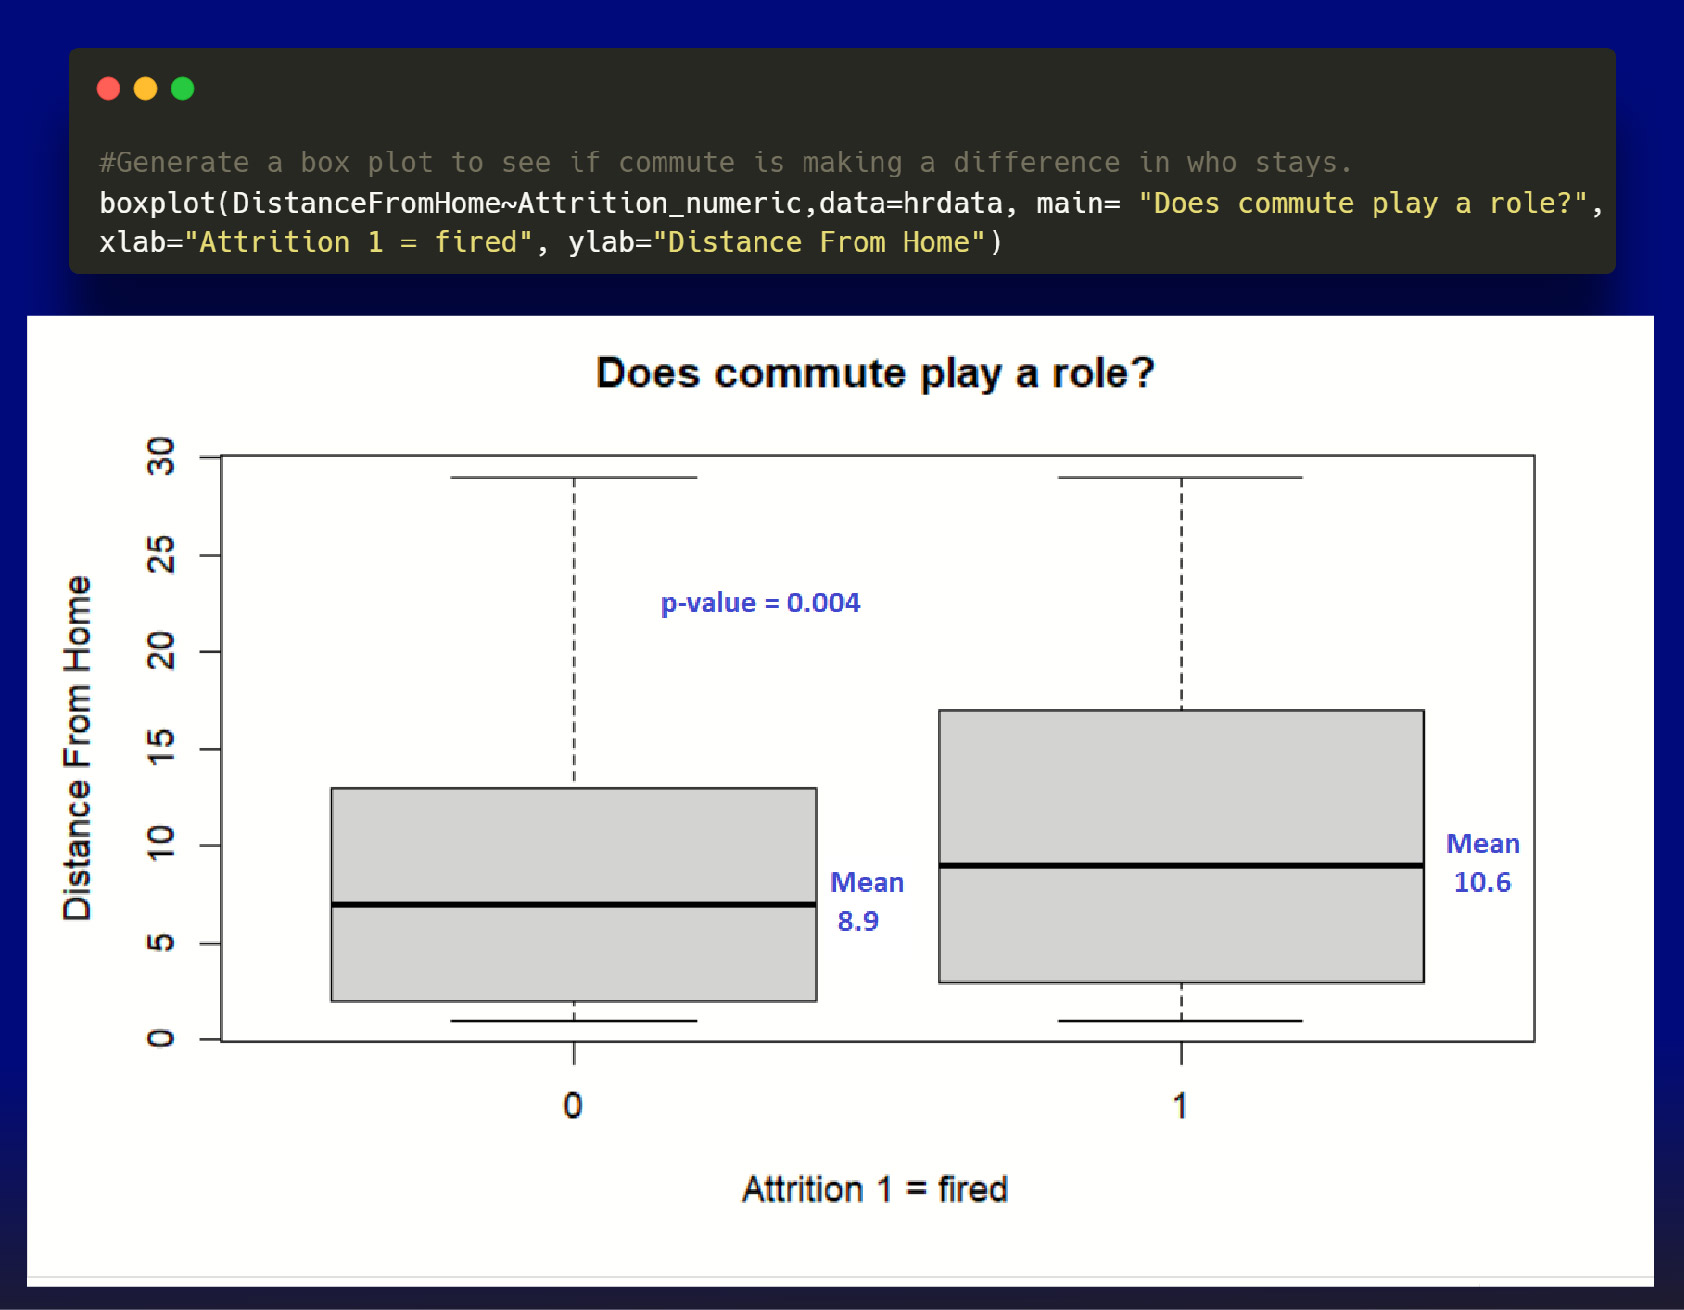
The low P-value shows there is a substantial difference, and we can reject the null hypothesis. The box plot shows greater attrition rates for longer trips. As a result, employees who live closer to the workplace tend to stay with the company for longer. Overall retention appears to be influenced by commute distance.
Key Insights
- Younger employees are being laid off more.
- Tenured employees are not let go any more than new employees.
- We are not able to see any evidence that one gender is targeted
- Employees who work overtime are four times more likely to leave.
- Lab technicians had the most Employees leave. The sales team has the highest turnover.
- A shorter commute is much better for retention.
** The immediate takeaway from the retention study is to prioritize work-life balance with a small commute, address overtime impact, and foster job satisfaction with the sales team for a thriving workforce.
Thank you for reading through my article on HR data analysis. If you enjoyed the study Please connect on LinkedIn and check out my other projects.
